Splice Heatmaps
plot_splicing(database, gene, max_isoforms = -1, zoom_in = c(0, 1), apply_max_to_splicing = F)
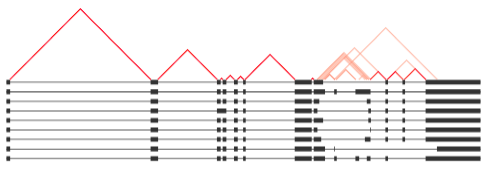
Generates a plot showing isoforms for one gene represented in genome-aligned format. Like a sashimi plot, splice junctions are represented as lines connecting splice donor and acceptor sites. Lines are colored according to the relative frequency of the splice junction occuring in the data. By default, the entire gene length and all isoforms are shown, but parameters allow for only the top X isoforms to be shown. In addition, an interval representing the portion of the gene body to zoom in on can be input, either as two fractions betwen 0 and 1, or as genomic coordinates.
Arguments
database |
A compiled Database object. |
|---|---|
gene |
Name of the gene to show. |
max_isoforms |
Number of isoforms to plot. The top [max_isoforms] isoforms are chosen in decreasing order of abundance (most common isoforms first). |
zoom_in |
Vector of two numbers, representing the interval of the gene length to show. If both numbers are between 0 and 1, inclusive, then this range is interpreted as fractions of the total gene length (e.g., zoom_in = c(0.25, 0.75) shows only the middle half of the gene). Otherwise, the numbers are interpreted as genomic coordinates for the chromosome that the gene is on. |
apply_max_to_splicing |
Logical. If some isoforms are filtered out using max_isoforms, recalculate the splice junctions shown based on only the isoforms shown. |
Returns
A splice heatmap plot constructed as a ggplot object.Example Usage
                       # database setup
                      gene_ID_table <- data.frame(ID = c("PB.1"), Name = c("Gene1"))
                      rawDB <- compile_raw_db(transcript_file, abundance_file, gff_file, ORF_file)
                      DB <- process_db(rawDB, gene_ID_table)

                      plot_splicing(DB, "Crb2")
                      plot_splicing(DB, "Crb2", max_isoforms = 5, zoom_in = c(0.9, 1))
                      plot_splicing(DB, "Crb2", max_isoforms = 5, zoom_in = c(64680000, 64694500))   # zoom in using genomic coordinates
Notes
Requires theggplot2 and reshape2 packages.
This function utilizes R plotting functionality in unconventional ways, so it may not be as robust as other functions in this package. If you find a bug, please report through a Github issue or email. This function is also not intended to replace IGV or other genome browser-based visualization. To export any Database to GFF format for genome browser viewing, you can use the
write_gff() function (see Walkthrough).