Clustering Isoforms by Sequence
To investigate the relationships between isoforms for one or more genes in your dataset, IsoPops can perform hierarchical clustering in two steps:
- Quantitatively represent transcript (or ORF) sequences as vectors via gene-agnostic, annotation-agnostic k-mer counting.
- Run a hierarchical clutering algorithm on these vectorized representations of isoforms.
Both steps are each performed with a single function call in IsoPops, as shown below:
                    counts <- get_kmer_counts(DB, genes = c("Crb1"))
                    cluster_isoforms(DB, counts)
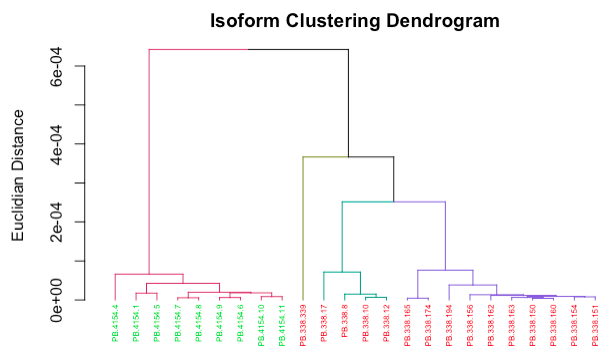
The cluster_isoforms() function produces a dendrogram plot of all the isoforms for the genes input. You can also supply your list of genes to the cluster_isoforms() instead of a pre-generated k-mer counts object, and the k-mer counts will be generated on the fly. This is only recommended if the number of isoforms for the genes input is small; otherwise, generating the counts only once and then re-running the clustering step as needed, passing in the counts object to cluster_isoforms(), is ideal.
cluster_isoforms() takes in two arguments, num_clusters and cut_height, for determining where on the dendrogram to cut in order to form clusters.
To generate these plots using ORF sequences instead of transcript sequences, simply add the argument use_ORFs = T to both functions.